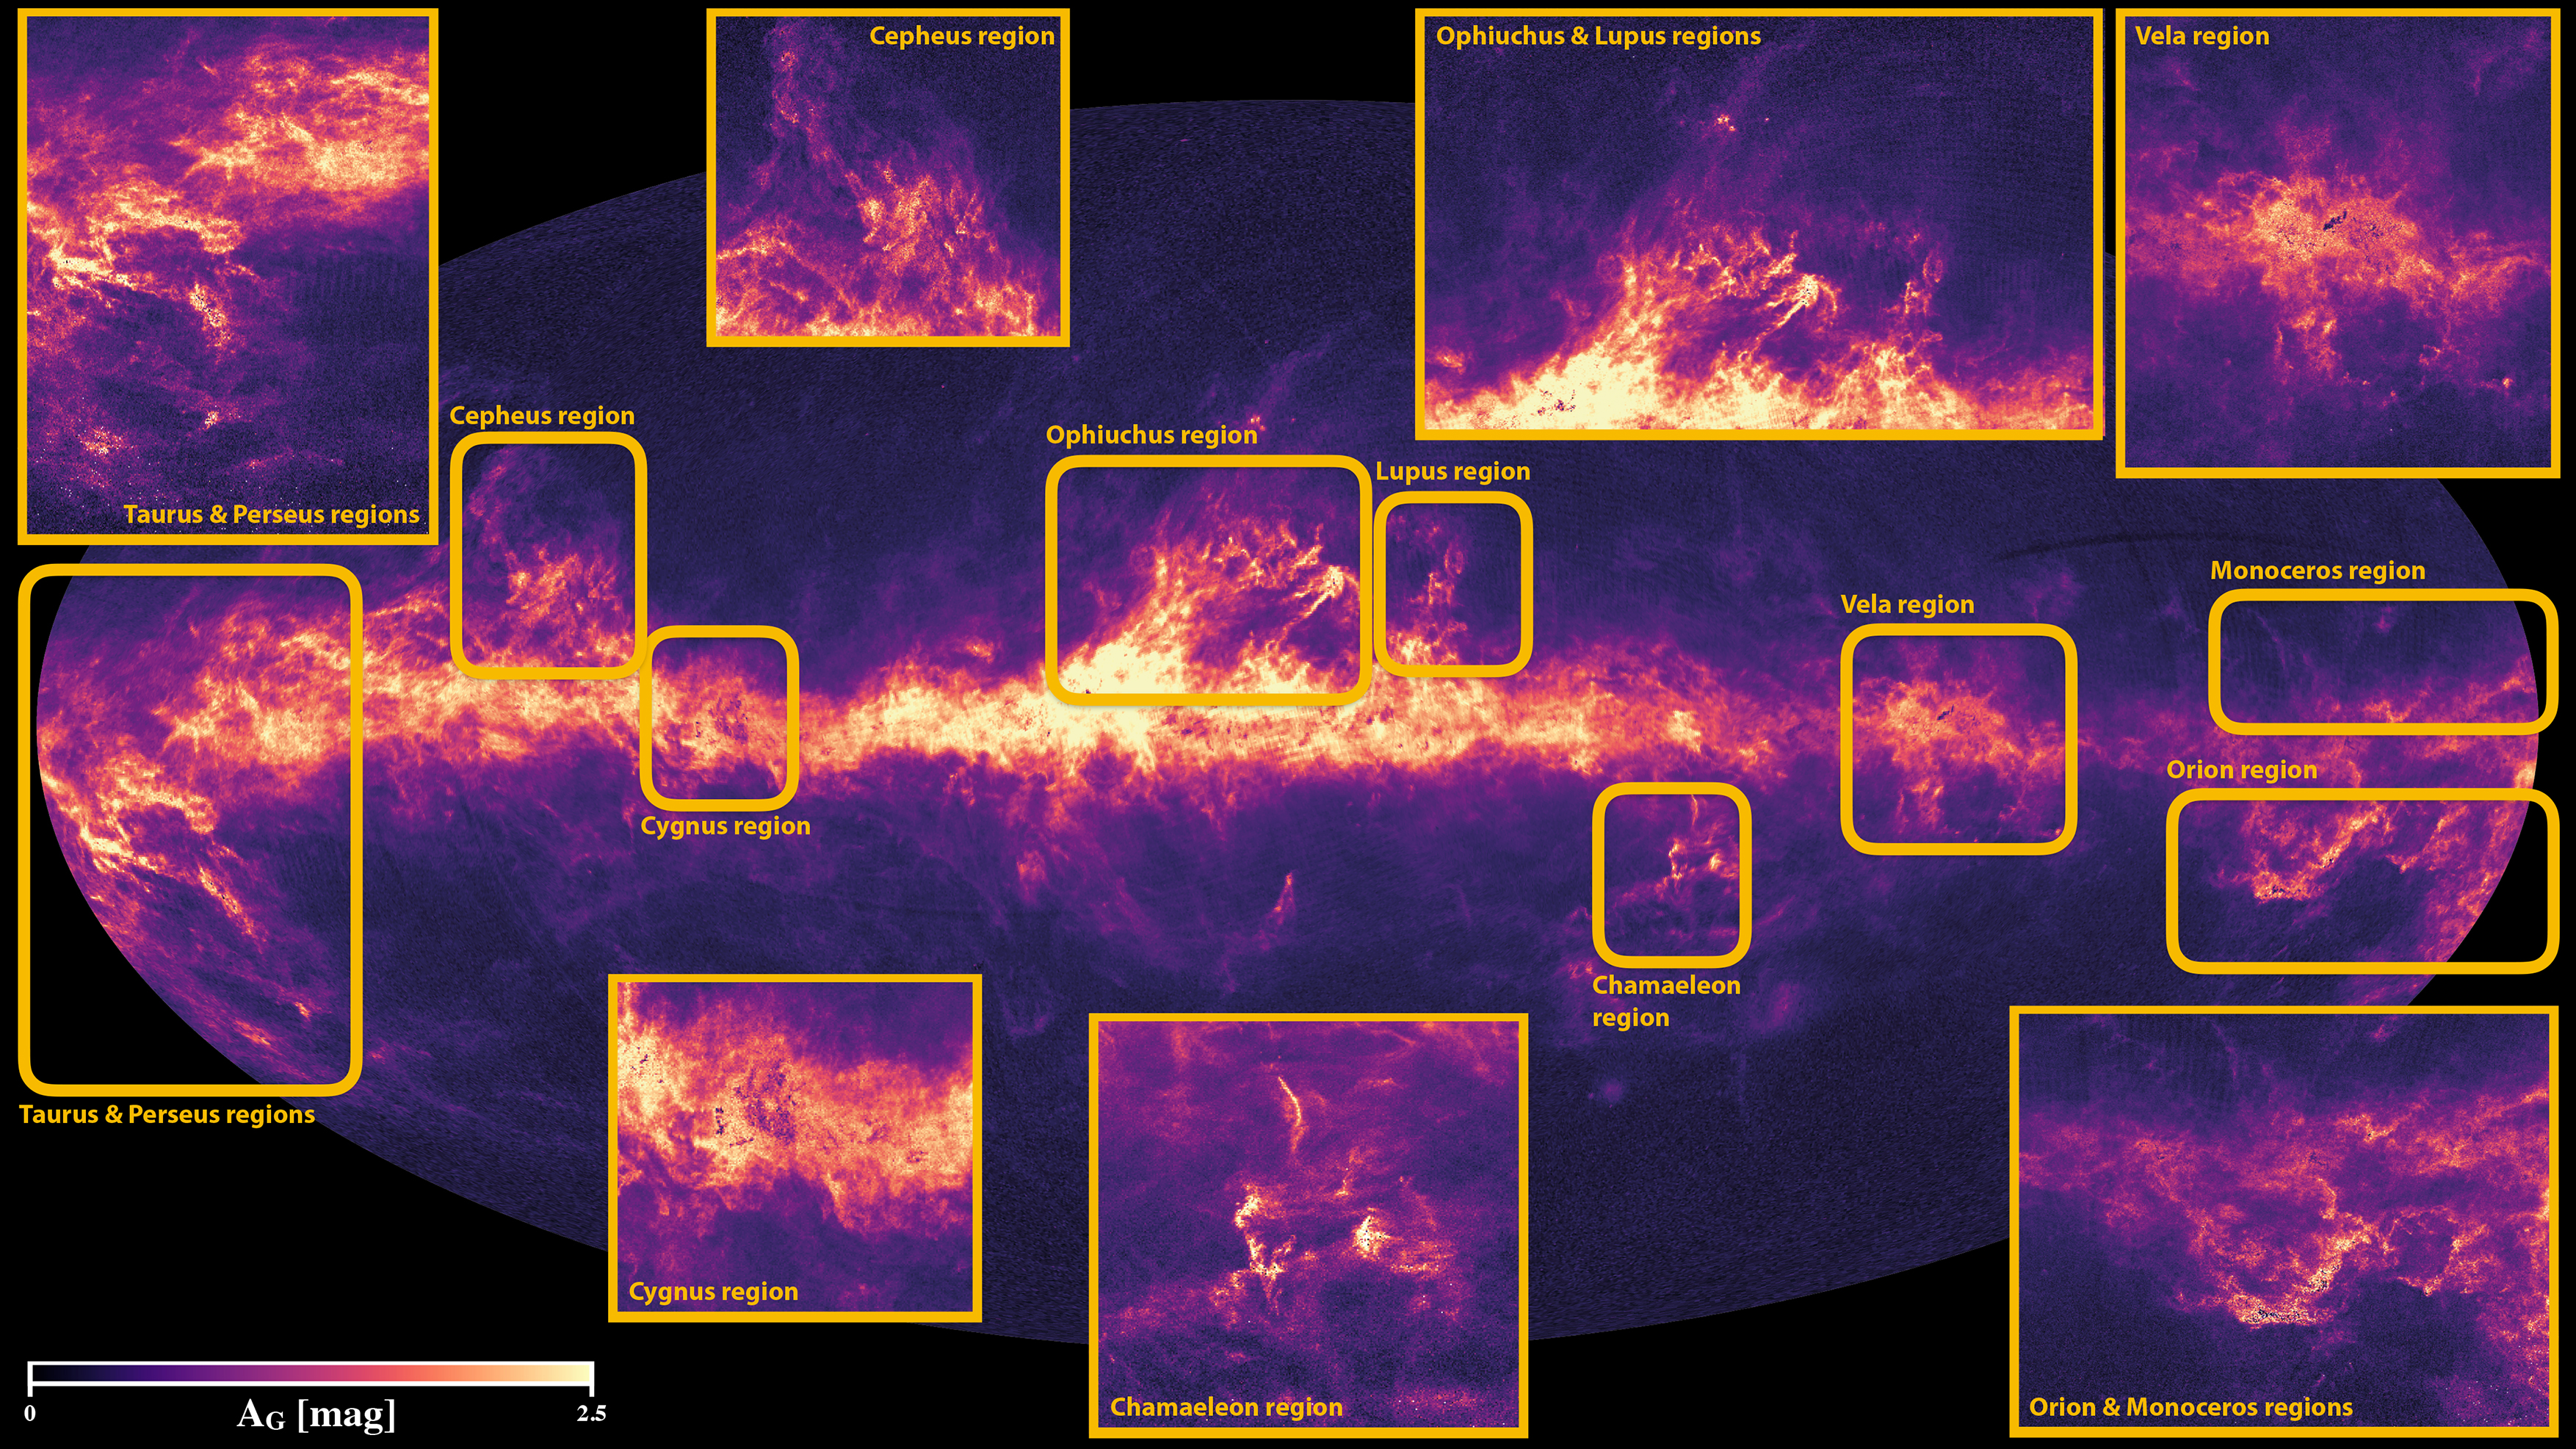
From Andrae, Fouesneau, et al. 2018, Distribution of $A_G$ (averaged over all parallaxes) in Galactic coordinates (Mollweide projection). The map is centered on the Galactic Center, with longitudes increasing towards the left.

From Andrae, Fouesneau, et al. 2018, Colour–magnitude diagrams for the Hyades, Pleiades, and Praesepe star clusters. In each panel we indicate cluster members (defined by Gaia Collaboration 2018a) using filled circles coloured according to their extinction estimates (white symbols are members without published extinction estimates in Gaia DR2). The solid lines indicate the PARSEC isochrones with parameter values, marked in the figure, taken from the estimates for the clusters from Castellani et al. (2002) for the Hyades and Pleiades and from Taylor (2006) for Praesepe.
Gaia project
- url: Gaia Cosmos Portal
- Gaia measures the positions, distances, space motions and many physical characteristics of some one billion stars in our Galaxy and beyond.
Gaia Astrophysical Parameters
The second data release of ESA’s Gaia satellite, published April 2018, not only includes data that allows us to compute accurate distances for 1.33 billion stars. we have also used Gaia’s measurements to derive the physical properties of almost 80 million stars, making this the largest stellar census yet. At the same time, the analysis provides the most detailed three-dimensional map of dust in our home galaxy yet, which promises to put the analysis of celestial objects on a more solid footing than before. However, this dataset remains a teaser to the future Gaia data relases.