pystellibs - making synthetic spectra#
This is a set of tools to compute synthetic spectra in a simple way, ideal to integrate in larger projects.
This package provides a common interface to compute a single or a collection of spectra using spectral libraries or atmospheres.
Package main content#
The main package articulates around 2 parts:
pystellibs.stellib.Stelliba stellar spectra library, commonly normalized to bolometric luminositiespystellibs.stellib.AtmosphereLiba stellar atmosphere library, commonly normalized to stellar radii.
The interpolation within libraries is left as a separated component.
This package provides already multiple input libraries:
pystellibs.basel.BaSeL: BaSeL 2.2, ~ Atlas 9 empirically recalibrated (Leujeune et al 1998)pystellibs.rauch.Rauch: a White dwarf librarypystellibs.kurucz.Kurucz: Castelli and Kurucz 2004 or ATLAS9pystellibs.tlusty.Tlusty: NLTE O, B stars [Lanz, T., & Hubeny, I. (2003)]pystellibs.elodie.Elodie: version 3.1, high resolution optical library.pystellibs.munari.Munari: extended ATLAS9 stellar atmospheres (Munari et al. 2005 A&A 442 1127)pystellibs.btsettl.BTSettl: BT-Settl Library (Allard, Hauschildt and Schweitzer 2000)
Future libraries to be included:
XSL: Xshooter spectral library
PHOENIX
MARCS
References (TBU)#
Leujeune et al 1998: http://cdsads.u-strasbg.fr/abs/1998yCat..41300065L
API#
The API has been reduced to minimum to make it easy to use. Mostly 2 functions:
Stellib.generate_stellar_spectrum()that computes one spectrum for one set of stellar parametersStellib.generate_individual_spectra()that computes a spectrum for each of many sets of paramaters
Contents:
Quick Start#
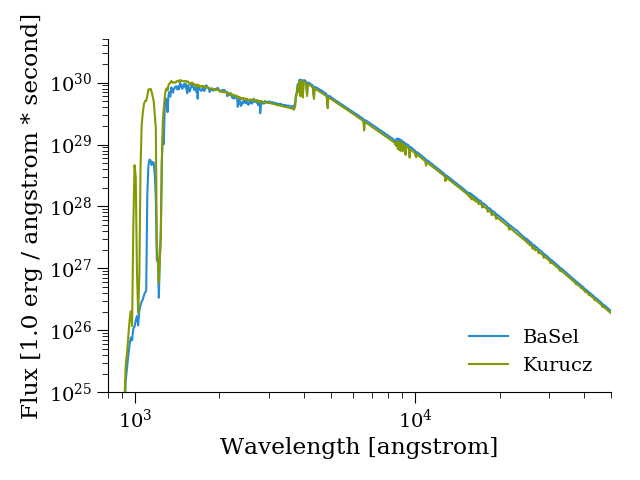
This example shows how to use one of 2 libraries to compute a spectrum
import pylab as plt
from pystellibs import BaSeL, Kurucz

# load 2 libraries
basel = BaSeL()
kurucz = Kurucz()
ap = (4., 3.5, 0., 0.02)
sb = basel.generate_stellar_spectrum(*ap)
sk = kurucz.generate_stellar_spectrum(*ap)
plt.figure()
plt.loglog(osl._wavelength, sb, label='BaSel')
plt.loglog(osl._wavelength, sk, label='Kurucz')
plt.legend(frameon=False, loc='lower right')
plt.xlabel("Wavelength [{0}]".format(basel.wavelength_unit))
plt.ylabel("Flux [{0}]".format(basel.flux_units))
plt.xlim(800, 5e4)
plt.ylim(1e25, 5e30)
plt.tight_layout()
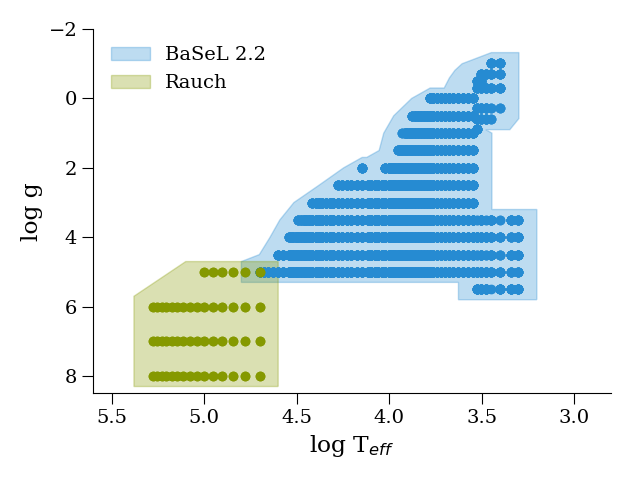
Combining multiple libraries (with priority): the following example combines BaSeL with white-dwarf models.
from pystellibs import BaSeL, Rauch

# Combine 2 libraries by priority order
lib = BaSeL() + Rauch()

for osl in lib._olist:
    l = plt.plot(osl.logT, osl.logg, 'o')[0]
    osl.plot_boundary(color=l.get_color(), dlogT=0.1, dlogg=0.3, alpha=0.3,
                      label=osl.name)

plt.xlim(5.6, 2.8)
plt.ylim(8.5, -2)
plt.xlabel('log T$_{eff}$')
plt.ylabel('log g')
plt.tight_layout()

plt.legend(frameon=False, loc='upper left')