Photometric computations#
For the photometry, we use pyphot a suite to compute synthetic photometry in flexible ways.
dustapprox.io.svo.get_svo_passbands()to interface the SVO Filter Profile Service, which provides us with a large collection of passbands. This a wrapper around pyphot.
example usage
import matplotlib.pyplot as plt
from dustapprox.io import svo
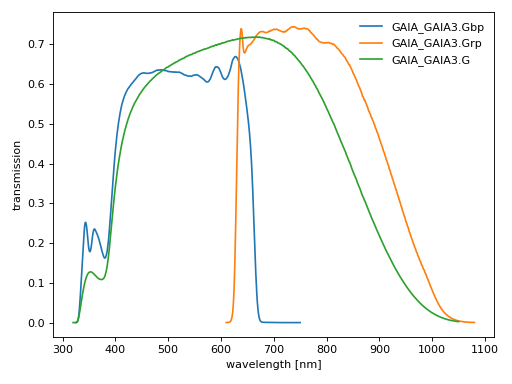
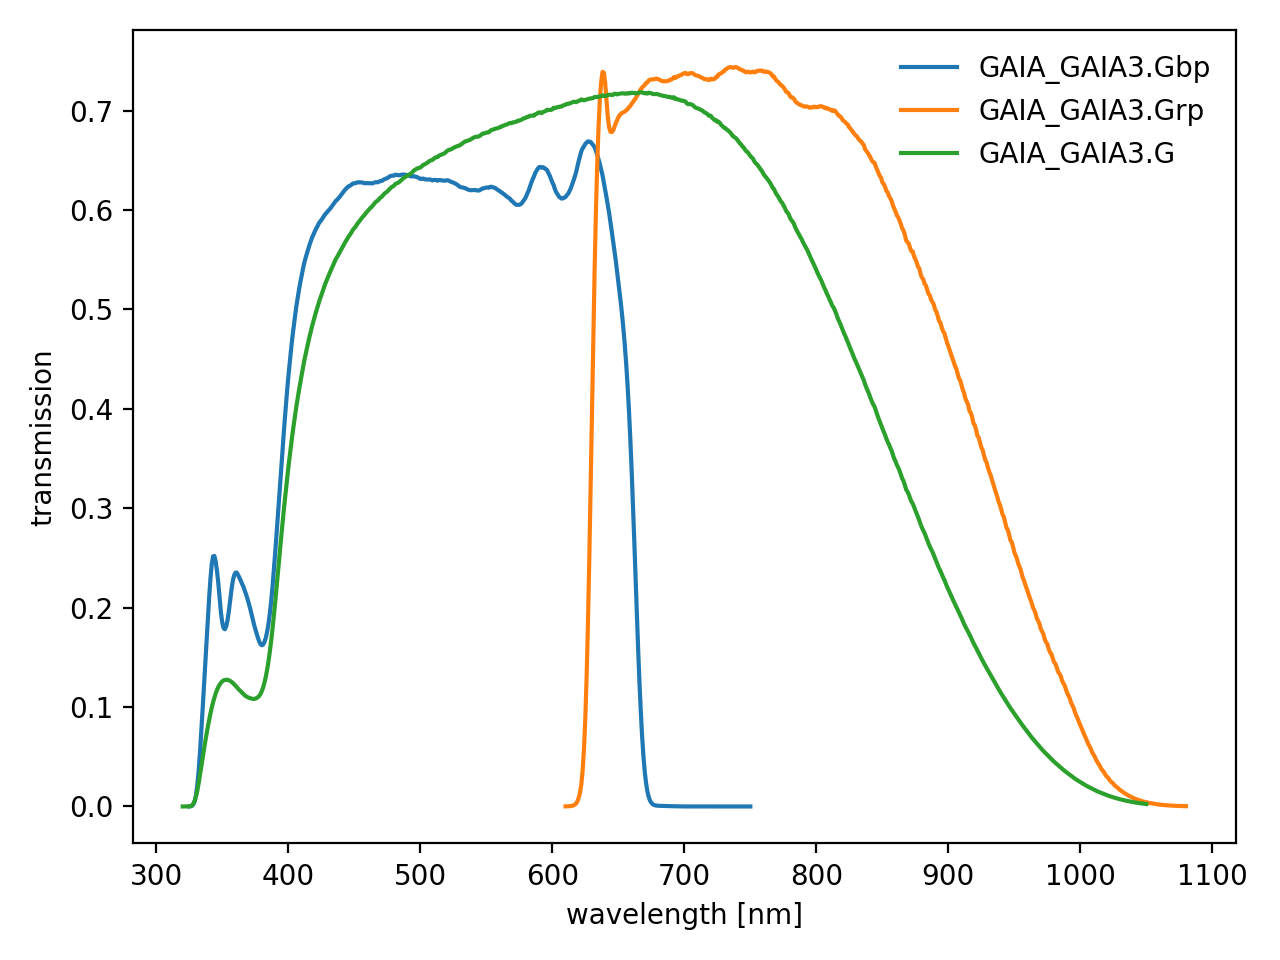
which_filters = ['GAIA/GAIA3.Gbp', 'GAIA/GAIA3.Grp', 'GAIA/GAIA3.G']
passbands = svo.get_svo_passbands(which_filters)
for pb in passbands:
plt.plot(pb.wavelength.to('nm'), pb.transmit, label=pb.name)
plt.legend(loc='upper right', frameon=False)
plt.xlabel('wavelength [nm]')
plt.ylabel('transmission')
plt.tight_layout()
plt.show()
(Source code, png, hires.png, pdf)

Fig. 6 Figure 3. This figure shows the Gaia eDR3 passbands retrieved from the SVO service.#